Building data science tools to identify dangerous traffic intersections
A traffic intersection can be a very dangerous place. When I was living in Pittsburgh, I personally witnessed 3 accidents in the intersection by my apartment. From driving in that intersection, I knew that it had a legal right-on-red, but there was a blind spot. As you turn right, there’s a small moment where you just have to hope that no one is coming.
My data set on that intersection was pretty large–I drove that intersection every day and I saw the consequences of when people made bad choices. But it got me thinking–if we were able to look across intersections in a city, could we predict what features made some intersections more dangerous than others?
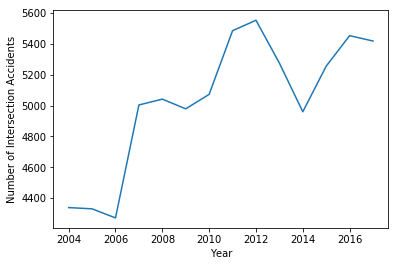
In setting out to build a tool to accomplish this, I downloaded traffic incident records, speed limits, and traffic signage data for over 5,000 intersections from the City of Pittsburgh. It turns out, from 2004-2017, 43% of traffic accidents in Pittsburgh occurred in intersections. This is incredible considering that intersections represent such a small percentage of our roads. The number of intersection-based accidents has also been increasing over the past few years:
Pittsburgh’s intersection Accident Rate is Increasing
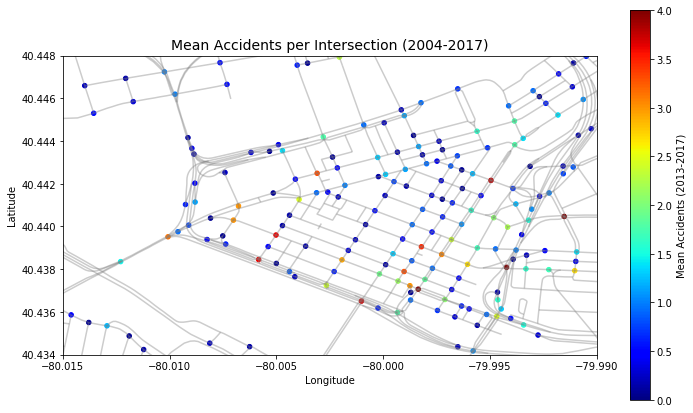
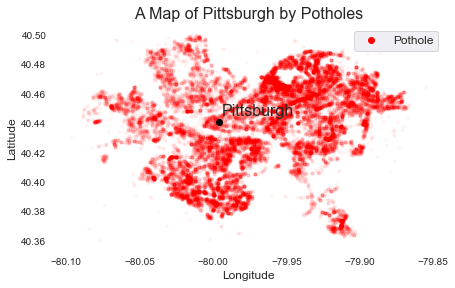
If you build a map of these intersections, you can see that some are safer than others. Now, a lot of this is likely due to the fact that some intersections just deal with a lot more traffic than other intersections. But there’s also some structural features of an intersection that might contribute that threat. For instance, maybe the presence of a right-on-red might contribute or the speed limits of the roads leading into that intersection.
Intersection safety is highly variable across Pittsburgh
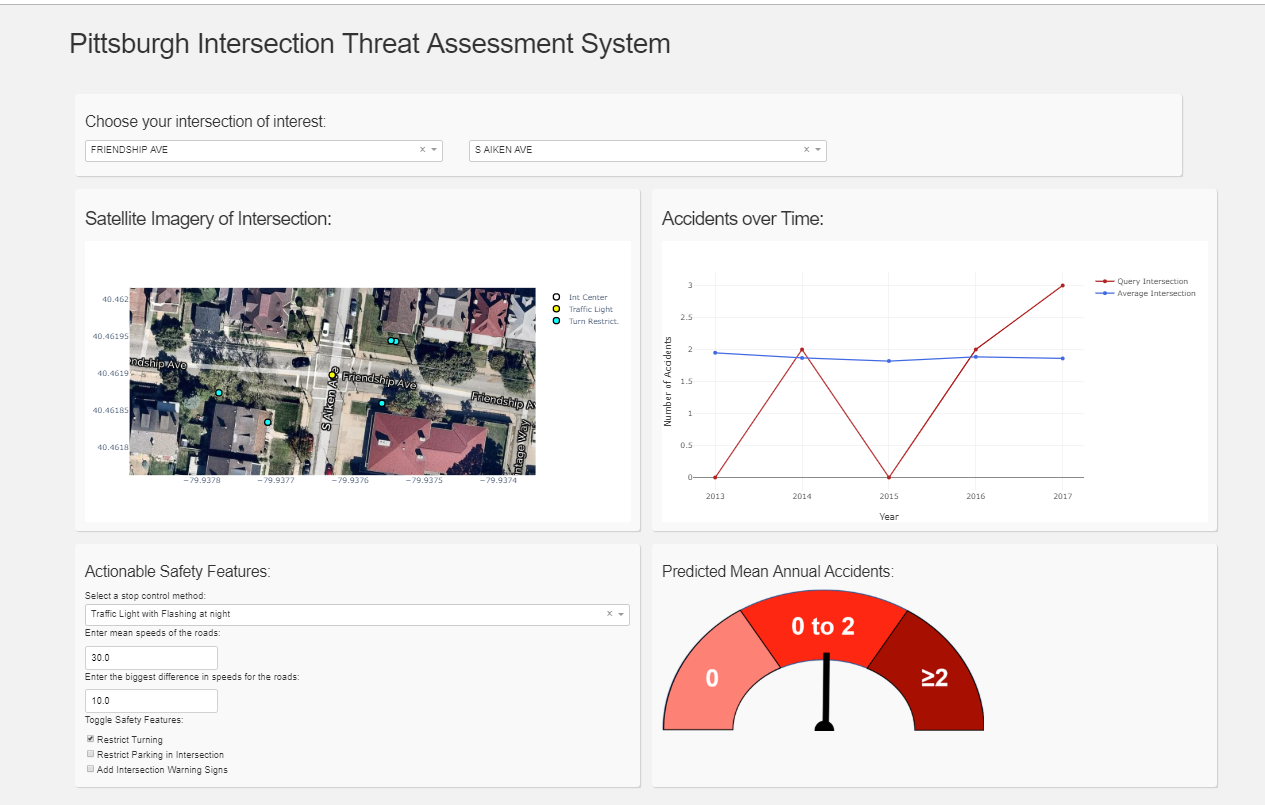
I ultimately decided to make a dashboard called the Pittsburgh Intersection Threat Assessment System (PITAS) that could allow users to track the safety of different intersections in Pittsburgh. It also lets users toggle different safety features in the intersection (stop signs v. traffic lights, road speed, and turning restrictions) to see how that would impact the predicted safety score. I used a random forest classifier model to predict intersection safety with the new set of safety features. The classifier did a decent job, with an F1 score of 0.77 across a 3 level safety scale.
The PITAS interactive dashboard
I hope that this tool (or something like it) can empower city planners to use publicly available data to do more to audit and improve the safety of traffic intersections. The model itself can be used to make some insights about what features are effective in intersections. The random forest model maintains full explainability of its results, and so it can be used to interrogate the feature importance for everything going into the model:
The relative importance of PITAS intersection features
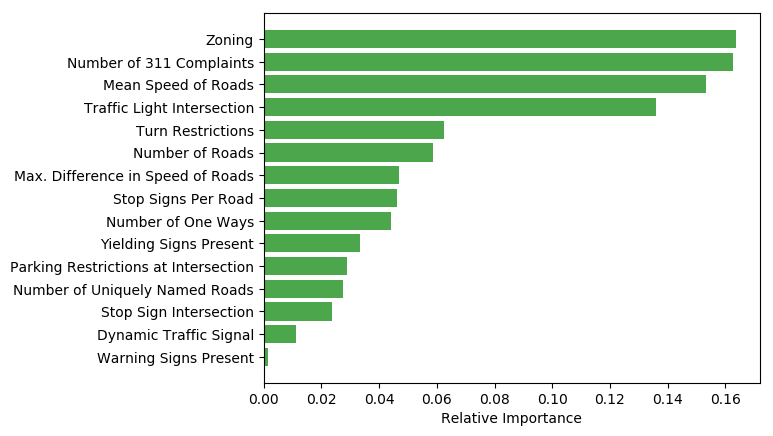
This shows us that faster intersections in areas non-residentially zoned areas (read: likely areas with more traffic) are more dangerous. And it also shows us that intersections that get more complaints (measured by the number of people calling into 311 about the intersection) actually might merit a closer examination by city planners. It’s also interesting to note that Warning Signs (like the signs that say “traffic signal ahead”) contribute the least to our prediction! This might suggest that these solutions are wasting time and money and, perhaps more dangerously, giving people a false sense of security about an intersection.
Anyways, I hope you enjoy the tool. And please drive safe out there and use your turn signals!!!
Leave a comment